Forecast vs Actual
Your plan says what you intend. Your transactions say what happened. Two pages put those side by side: Plan > Budget for the month you’re in, and Plan > Annual for the whole year at once.
The Month: Plan > Budget
Plan > Budget is the working view. Three tiles across the top give you income, spending and net - each showing actual against planned. Below them, every Maslow level is a section, and every plan item inside it is a row.
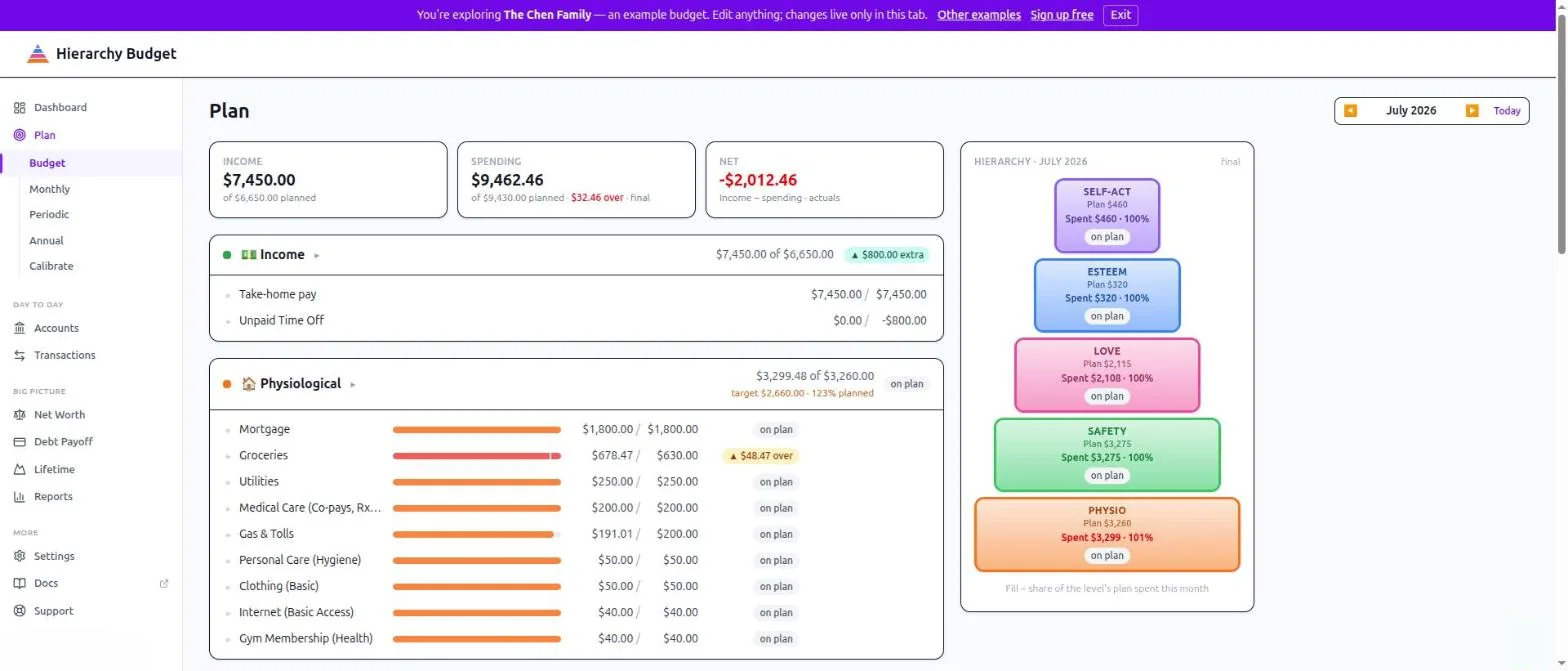
Each row shows:
- A fill bar - how much of that item’s plan you’ve spent
- Actual / planned - the two numbers, in that order
- A status chip - on plan, $48.47 over, or under
Level headers carry the same summary for the whole level, plus the allocation target you set in Settings > Allocation - so you can see both “am I spending what I planned?” and “is that plan the shape I wanted?”
Click any row to open its drilldown: the transactions behind that number, and the plan item that produced the forecast.
The pyramid rides along
On wide screens the hierarchy itself sits beside the budget - one block per level, each filling in as that level’s plan is spent. It’s the same pyramid the dashboard shows, with one difference that matters: the dashboard only ever shows the current month.
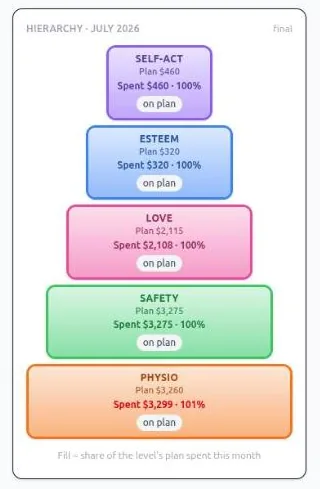
Step back through prior months with the month picker and the pyramid re-draws for each one, showing that month’s final shape. Flipping through a few months this way is the fastest read on whether your plan holds up over time - the levels that keep running over are visible before you’ve looked at a single number.
Spending you didn’t plan for
A category you spent in but never budgeted still gets a row, with a plan of $0 and your actual spending beside it. That’s deliberate - unplanned spending should be visible, not silently missing. Those rows offer Set plan so you can fold them into the budget without leaving the page.
Anything with no category at all rolls into an Uncategorized group at the bottom. Clear it from the Inbox.
The Year: Plan > Annual
Plan > Annual is one 12-month grid for a single year. Income at the top, then expenses grouped by Maslow level, then every item as its own row.
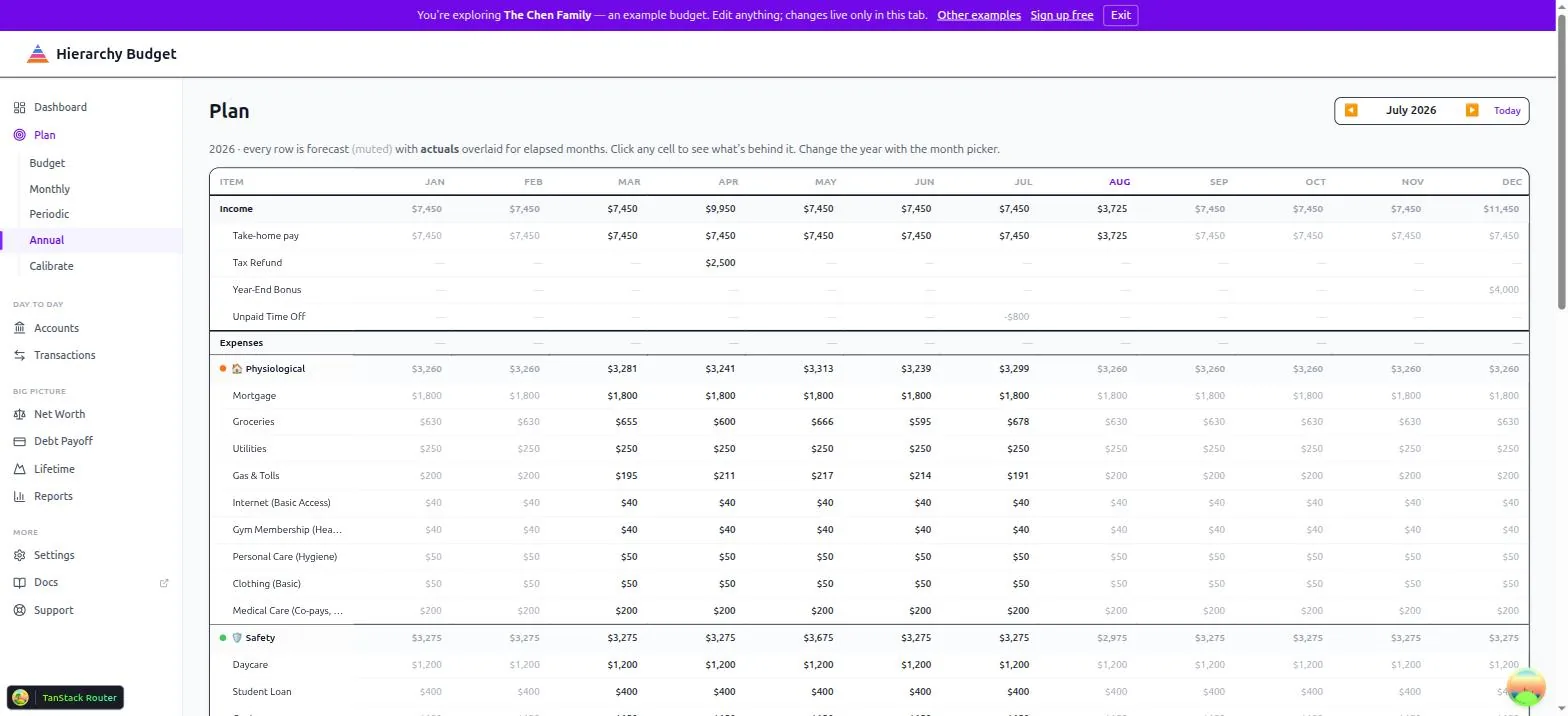
Reading the grid: every cell is the forecast, shown muted. For months that have already elapsed, actuals are overlaid in solid text. So a row reads left to right as “here’s what really happened, and here’s what we still expect.”
Click any cell to see what’s behind it - the plan items that produced the forecast, and the transactions that produced the actual.
Change the year with the month picker in the top right. That picker is shared across every Plan tab, so switching months on Budget and switching years here use the same control.
Where the Forecast Comes From
- Monthly items - from Plan > Monthly, your recurring income and expenses, converted to a monthly equivalent if they’re weekly or quarterly
- Periodic items - from Plan > Periodic, landing in the months they’re scheduled for
- Cell edits - a number you type directly into the Annual grid becomes a one-off adjustment for that month, without disturbing the recurring baseline
Where the Actuals Come From
Actuals are your categorized transactions. A transaction reaches the right row through its category - the category carries a Maslow level, and that level is where its spending lands.
Transactions still waiting in the Inbox already count toward actuals; approving them is about categorizing correctly, not about making them appear. Transactions with no category at all show up under Uncategorized.
Transfers between your own accounts are excluded. Moving money from checking to savings isn’t spending.
Reading the Variance
Income: ahead of plan is good, behind is not.
Expenses: under plan is good, over is not.
Don’t read a single over-plan month as failure. A large, persistent variance usually means the plan is wrong, not that you are - and the fix is Plan > Calibrate, which reads your real spending history and suggests plan items you’re missing.
Tips
Start with the month. Budget is the page you’ll actually use week to week. Annual is for seeing shape and timing.
Drill into the big variances. The number tells you something is off; the drilldown tells you what.
Check your periodic timing. An insurance premium scheduled in the wrong month makes two months look wrong.
Related Pages
- Plan > Budget - This month, plan against actual
- Plan > Annual - The full year grid
- Plan > Monthly - Set up recurring items
- Plan > Periodic - Set up annual and periodic items
- Plan > Calibrate - Let your history suggest the plan
- Reviewing Transactions - Keep actuals accurate
- Settings > Allocation - Allocation targets